Retention #Wins — How Small Retention Gains(~5%) Result In Massive LTV Improvements(~30%)and a Scalable Growth Formula
When I tell people I helped grow user acquisition spend from $0 to $1.5 million per month for an app I worked on by improving retention, they want to know how.
Improving retention can have a massive impact on user lifetime value (LTV) — a potentially far bigger bang for your user acquisition bucks than creative formats (videos, playables) or different messaging and targeting strategies.
**
Let’s assume a product has a retention curve as shown below (from day 1 to day 365).
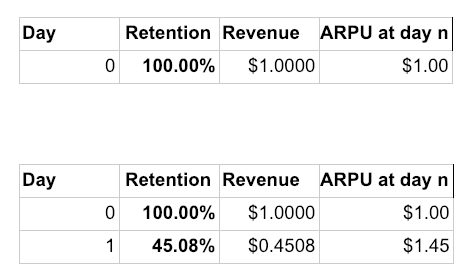
For the sake of simplicity, let’s say that users pay $1 per day, i.e. the average revenue per daily active user (ARPDAU) is $1.
So at the end of day 0 and day 1, this is what the product’s monetization would look like:
So the product makes $1 from users who come in on day 0, and $0.45 from users who come in on day 1.

The product’s average revenue per user (ARPU), which equals the mean aggregate revenue per user over time instead of per day, would be $1.45 after day 1.
At day 7, ARPU would look like this:

We can calculate that ARPU after 365 days would be $50.95 (full spreadsheet with calculations here).
**
Let’s look at how increasing the retention rate affects the ARPU (or LTV), in that the greater the ARPU or the LTV, the more you’d be comfortable spending.
Let’s say you put in a significantly better onboarding experience or you’ve made a fundamental change to your product’s monetization (which we did by sacrificing monetization for retention).
Let’s assume that for day 1 through 7, retention improved by 5%.
Here’s how the two retention rates compare over the first 7 days:

To estimate the new retention curve from day 8 to day 365, we’ll assume that it follows a power series whose equation we’ll look at below.
In Google Spreadsheets or Excel, we’d make a trendline using the retention curve for the first 7 days, meaning the equation for the retention curve would be: y = 0.492x^-0.211.
Now, by applying the equation to days 8 through 365, we get the new retention curve with improved upstream retention (day 1 to 7) as shown above.
Finally, we have the complete old & new retention curves as well as the ARPU/LTV at various points of time.

If we compare the 7-day ARPUs for the old vs. the new retention curves, we’ll see a $0.25 or ~7.4% improvement.
Now let’s look at what happens if we calculate the ARPU for 365 days, comparing the old and new retention curves:

That’s a staggering 30% increase in ARPU or LTV as a result of a feature that improved d1 through d7 retention by 5%.
Clearly, improving the retention rate has a significant impact.
Let’s look at the retention curves again to understand this.
The ARPU or the LTV (assuming constant ARPDAU, as we’ve done in our analysis) corresponds to the area under the retention curves.
The difference during the first 7 days isn’t huge but grows as time goes by. At the completion of a year, the difference in LTV as a result of cumulative retention improvements is substantial.
Qualitatively, if more users love your product after installing it (perhaps because you provide a better onboarding experience or make monetization user-friendly), more of them stick around for the long-term — and your overall economics are much stronger.
Translating retention improvements into scale: tips for ramping UA spend
So you’ve built a strong product and established a strong retention profile. Where do you go from there? Here are some pointers based on my experience:
- Ascertain your acceptable payback period
- Model out your LTV for this payback period.
- Make sure your LTV calculations are done after accounting for platform fees (for example, if you were to spend $1 to acquire a user and they ended up making $1.30 in purchases, you’d have a negative return on investment post platform fee. This is because $1.30 * 70% = 91 cents in earnings, resulting in a loss).
- Make a near to mid-term budget for your UA activities.
- Review your cash situation and make sure you have enough cash to be able to invest in UA activities — after you account for potential delays in getting paid back by the app stores and ad networks.
- Quickly boosting your cash flow position can often be tough due to the 45–60+ day payment cycles of the major app stores and ad networks. Financing these accrued but unpaid receivables is one way to free up cash flow without having to fundraise.
- Roll out your UA activity — and ramp up your spending.
[Spreadsheet with the numbers used in this analysis here. Numbers are hypothetical, learnings and takeaways are not.]
[Shamanth Rao is the founder and CEO of RocketShipHQ, a boutique growth marketing firm specializing in performance marketing driven by high velocity video ad production. Previously, Shamanth led growth efforts leading to two acquisitions — Bash Gaming (acquired for $170 million) and PuzzleSocial (acquired by Zynga).]

